In the dynamic mobile app industry, tracking and understanding key metrics is crucial for the success and growth of any app. This blog post delves into essential mobile app metrics and KPIs, providing definitions, methods for tracking or calculating, and relevant examples to help product managers make data-driven decisions.
When analyzing the performance of a mobile app, metrics play a crucial role. They track the performance of specific processes or activities and provide detailed insights into various aspects of an app’s operation. This helps in understanding how different elements contribute to overall performance. Examples of metrics include download counts, the number of push notifications sent, the number of screen views, as well as the number of searches, messages sent, and photos uploaded.
On the other hand, Key Performance Indicators (KPIs) are a subset of metrics that are directly tied to your strategic goals. KPIs help measure the success of your objectives and are critical in assessing the overall performance and health of your business. Examples of KPIs include Monthly Active Users (MAU) for tracking user engagement, Lifetime Value (LTV) for forecasting revenue per user, and Retention Rate for understanding user loyalty. However, it’s important to note that KPIs can vary for each app depending on its unique goals and objectives.
Acquisition metrics
Downloads and First-Time Open are Acquisition metrics that help measure how effectively your app is attracting new users and capturing initial interest.
Downloads measure the total number of times your app has been downloaded from app stores. This metric is essential for assessing the initial reach of your app and provides a clear indication of how effectively it is attracting potential users. First-Time Open tracks the number of users who open your app for the first time after downloading it.
It’s important to note that discrepancies can occur between these two metrics. They may come from different sources and can sometimes show mismatches of up to 20%. Such differences may be due to factors like delayed installations, users who download but do not immediately open the app, or variations in tracking methods. Understanding these discrepancies can help refine your acquisition strategies and improve overall engagement metrics.
Engagement metrics
When evaluating how users interact with your app, engagement metrics are crucial for understanding the depth of user involvement and the overall experience your app provides. Key engagement metrics include DAU/WAU/MAU, Stickiness, Retention Rates, Interval Sessions, and Average Sessions per User.
DAU, WAU, and MAU—Daily Active Users (DAU), Weekly Active Users (WAU), and Monthly Active Users (MAU)—are fundamental engagement metrics that measure the number of unique users interacting with your app over different time frames.

Firebase – Analitycs dashboard
Stickiness is derived from DAU and MAU and measures how often users return to your app. It’s calculated by dividing DAU by MAU, yielding a ratio that reveals the proportion of monthly users who engage with the app daily. A higher stickiness ratio suggests that users find the app valuable and are consistently returning.
Retention Rates—Day 1 (D1), Day 7 (D7), and Day 28 (D28)—track the percentage of users who return to your app after specific time intervals. Day 1 measures how many users come back the day after their initial use, Day 7 looks at user return a week later, and Day 28 assesses user return a month after the first use. These metrics are crucial for understanding how effectively the app retains users over time. While standards can vary by app type and industry, a Day 28 retention rate of around 4% is generally considered acceptable.
Interval Sessions measure the frequency of user sessions within specific time intervals. This metric helps assess how often users engage with the app during defined periods, providing insights into user habits and app stickiness. For instance, if users typically open the app three times a day, it suggests high engagement and frequent use.
Average Sessions per User calculates the average number of sessions each user has over a given time period. This metric helps gauge the overall level of user interaction with the app. For example, if your app has a total of 10,000 sessions and 2,000 users, the average sessions per user would be 5. This indicates how actively users are interacting with the app.
Together, these engagement metrics provide a comprehensive view of how users interact with your app, offering valuable insights into user behavior, satisfaction, and the overall effectiveness of your app’s features and content.

Firebase – Analitycs dashboard
Monetization metrics
When assessing how effectively your app is generating revenue, monetization metrics are key to understanding financial performance and user value. Two crucial monetization metrics are Lifetime Value (LTV), and Average Revenue Per User (ARPU).
Average Revenue Per User (ARPU) calculates the average revenue generated from each user over a specific period, usually a month. It is determined by dividing the total revenue by the number of active users during that period. For instance, if your app generates $30,000 in revenue from 3,000 active users in a month, the ARPU is $10. This metric provides insight into how much revenue each user contributes on average, helping assess pricing strategies and overall financial performance.
Lifetime Value (LTV) represents the total revenue a business anticipates earning from a user throughout their entire engagement with the app. It is a crucial metric for forecasting long-term revenue and assessing the overall profitability of acquiring new users.
A straightforward method to estimate LTV involves multiplying the average daily revenue per user (ARPday) by the average user lifespan (ALS). This approach provides a basic calculation of the revenue expected from a user over their lifetime with the app. For example, if the average daily revenue per user is $1 and the average user lifespan is 180 days, the LTV would be $180.
However, the most accurate method for calculating LTV can vary based on the app’s monetization model. More advanced techniques may incorporate multiple revenue streams, detailed user behavior patterns, and varying retention rates to refine the LTV estimate. The chosen approach should align with the app’s specific revenue dynamics and user engagement trends to ensure a precise forecast.
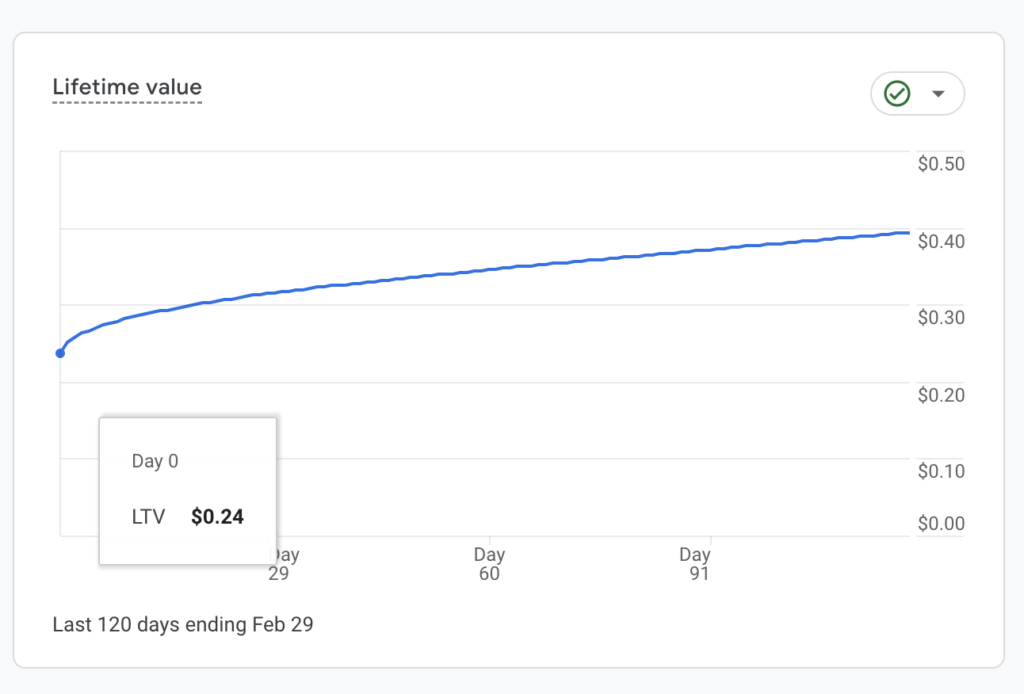
Firebase – Analitycs dashboard
These basic and essential metrics provide a foundational understanding of mobile app performance, but it’s important to recognize that the landscape of app metrics is vast. Depending on your app’s business model and specific goals, there are many additional metrics and KPIs that can offer deeper insights and drive more tailored strategies. Always align your metrics and KPIs with your app’s unique objectives to ensure a comprehensive approach to measuring success.
Gustavo Rubio
Senior Product Manager – App

With over 7 years of experience as a Product Manager in the mobile app industry, I have worked across various verticals, including utilities, social media, gaming, and mental health. I enjoy working with data, user research, APIs, and UX design to build amazing apps that delight users.